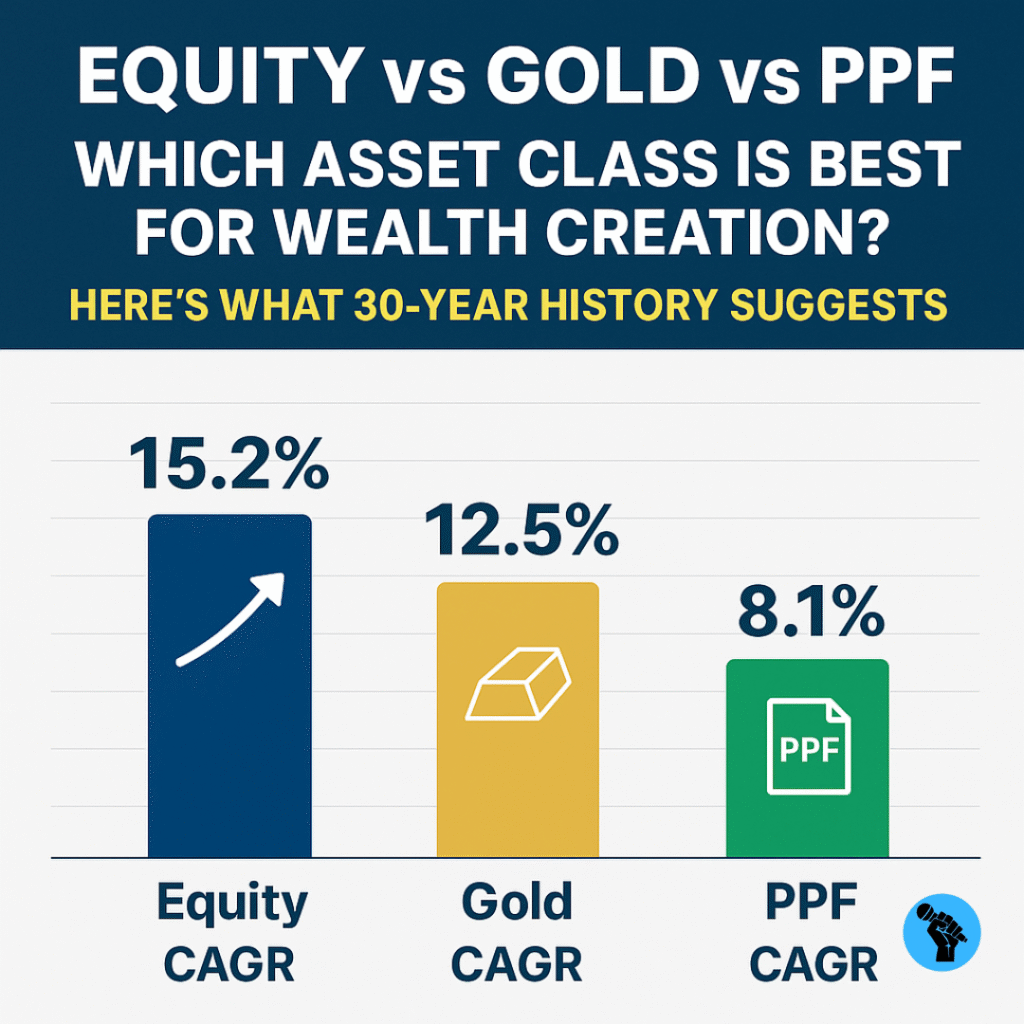
Equity vs Gold vs PPF: When it comes to long-term wealth creation, where should investors put their money — equities, gold, or Public Provident Fund (PPF)? A look at three decades of historical performance offers some compelling insights that can guide both young and seasoned investors.

30-Year Performance Snapshot: Equity Leads the Race
Historical data from 1995 to mid-2005 shows a clear trend — equities have consistently outperformed gold and fixed-income options like PPF and fixed deposits (FDs).
- Nifty 500 CAGR (1995–2005): 15.2%
- Sensex CAGR (1995–2005): 14.1%
- Gold CAGR (1995–2005): 12.5%
- PPF returns: 8.1%
- FD returns: 7.2%
The broader market, represented by Nifty 500, delivered higher returns compared to the benchmark Sensex, showing the strength of diversification.
Why Equities Outperform Over the Long Term
According to Vaqarjaved Khan, CFA, Senior Fundamental Analyst at Angel One, equities have generated around 14–15% CAGR over 20–30 years, which is significantly higher than fixed income (7–8%) and gold (10–11%).
He attributes this to:
- India’s fast-growing economy
- Strong corporate governance and rising profitability
- Continuous retail and institutional investor flows
“Investors are rewarded for the risks they take in equities. Over the long run, equities remain the best vehicle for wealth creation,” Khan noted.
The Role of Gold: Stability and Diversification
While equities dominate in terms of long-term returns, gold has played an equally important role in portfolio diversification.
As per Rajesh Cheruvu, MD & CIO at LGT Wealth India, gold has delivered 11–12% average returns with lower volatility compared to equities. It also acts as a hedge against inflation and remains uncorrelated with stock markets, making it a reliable risk-management tool.
Why PPF and Fixed Deposits Still Matter
PPF and FDs may not match equity returns, but they are safe, stable, and government-backed instruments that cater to investors seeking security and steady income. These instruments often form the backbone of retirement portfolios for risk-averse individuals.
Ideal Portfolio Allocation Based on Age & Risk Appetite
Experts suggest that asset allocation should be based on age, financial goals, and risk tolerance.
- Young Investors (20s–30s):
- 70% in equities (40% Nifty 50, 15% Nifty 500, 15% Mid/Small-cap funds)
- 15% in debt (for emergency needs)
- 15% in gold (ETFs or physical gold)
- Older Investors (60s & above):
- 15–20% in equities
- 65–70% in fixed income (PPF, FDs, bonds)
- Remaining in gold for inflation hedge
Key Takeaway: Equities Anchor Long-Term Wealth Creation
Over three decades, equities have clearly emerged as the strongest asset class for wealth creation, provided investors stay invested through market cycles. Gold adds stability, while PPF and FDs ensure safety.
In short, the winning formula lies in diversification — equities for growth, gold for balance, and fixed income for security.
